Not All Scales Are Created Equal:
Constructing Scales that Collect Predictive Data
When developing tools for online market research, there are three main objectives: create scales that are rigorous and robust, meet academic and research standards, and make these tools something that will be engaging and effective on the Internet. Here at TipTap Lab, we found this process to be easier said than done in many ways. We spent three years conducting exploratory research and testing and confirming validity in order to create a tool that provided a better understanding of people.
We followed the standard psychometric measurement formula (below) and discovered a new path to predictive data collection:
•Determine what you want to measure (vanity, price perception, agreeableness)
•Create scale and validate scale
•Refine methods of measurement (lather, rinse, repeat)
Creating the Image Selection Task
To develop our survey scales, our research team combed through over 60 years of research in the academic psychology literature to find useful and robust personality and consumer preference scales that have been empirically validated and published in peer-reviewed journals. While such scales are historically used to measure these psychological characteristics, we found a way to adapt them into web-friendly surveys because the original scales are not fit for an engaging online environment. These surveys generally consist of somewhere between 10 to 50 statements or questions an individual responds to on a numerical rating scale (e.g., a 1 to 7 agree to disagree Likert scale). In order to make them fit for use online, a proprietary process is used to create and validate a new scale consisting of a minimal set of click-through, picture-based questions. We then gather data to empirically confirm the new adapted scales measure the same traits as the original scales and have sufficiently robust psychometric properties. The result is a set of empirically validated surveys, all of which tap known traits and preferences directly, each consisting of a set of these new web-friendly items that people have said are generally pretty fun.
What goes into building a new task?
As we continue to broaden our scope of research, we continue to add new tasks or surveys to our repository. The process starts with a review of relevant literature in the fields of psychology and marketing related to what we’re trying to measure, with the goal of identifying a set of scales we or others might find useful when conducting research on a user (or consumer/person)’s motivations and habits. Typically these scales will consist of questions similar to the one shown here:
While these scales are powerful research tools, they present the user/survey respondent with a fairly bland experience and are often quite time consuming. When you want to get the most complete or complex understanding of a person, including numerous scales like these (which are often quite lengthy) creates problems -- respondents can become fatigued and bored, and the longer a task takes, the more money and effort you will spend collecting this data. As a researcher or business, you are often left with the dilemma of whether or not to include a measure that might be valuable, knowing full well the extra cost and lack of user engagement this could entail, as well as endangering the accuracy or your data. With the Psychology API, companies are not forced to trade off good data with engaging surveys, since the IST can do both.
In our early days, we developed a seven-item survey measuring value-consciousness, which takes less than a minute to complete, and no behaviors other than someone’s answers to the survey questions must be tracked to get this information. The result of the survey requires no other data to interpret since we already know what it means and it’s easy for anyone to understand. The information can easily be used inductively and predictively to make inferences about someone’s behavior outside of TipTap Lab’s local dataset by both people and our software.
So, while most traditional research employing traditional surveys consists of items like the question above, we might create something more along the lines of this, hoping to still capture the essence of the original scale:

The goal is to make the questions engaging and fun for the user. Various techniques can be used to make questions short and hold users’ attention; interesting or funny photos, parallel phrasing, rhyming, alliteration, or humor in wording are common techniques we’ll use.
Then comes the fun part: we analyze our newly constructed questions, compare them to the original measure we were hoping to capture, and then see whether or not we’ve captured a viable IST. It must have strong reliability/internal consistency as well as construct validity. We now have a short, fun and accurate tool that is useful for businesses, researchers and websites who want to study people and what motivates them, while still being entertaining for the users completing the surveys.
Inside TipTap Lab: Constructing Scales that Collect Predictive Data
When developing tools for online market research, there are three main objectives: create scales that are rigorous and robust, meet academic and research standards, and make these tools something that will be engaging and effective on the Internet. Here at TipTap Lab, we found this process to be easier said than done in many ways. We spent three years conducting exploratory research and testing and confirming validity in order to create a tool that provided a better understanding of people. As a result of this process, we created our Psychology API which allows for a superior alternative to traditional surveying and research techniques through an Image Selection Task (IST). This blog post provides a more detailed the process of what goes into creating each scale and task and as a result the power of the Psychology API.
We followed the standard psychometric measurement formula (below) and discovered a new path to predictive data collection:
Determine what you want to measure (vanity, price perception, agreeableness)
Create scale and validate scale
Refine methods of measurement (lather, rinse, repeat)
Creating the IST
To develop our survey scales, our research team combed through over 60 years of research in the academic psychology literature to find useful and robust personality and consumer preference scales that have been empirically validated and published in peer-reviewed journals. While such scales are historically used to measure these psychological characteristics, we found a way to adapt them into web-friendly surveys because the original scales are not fit for an engaging online environment. These surveys generally consist of somewhere between 10 to 50 statements or questions an individual responds to on a numerical rating scale (e.g., a 1 to 7 agree to disagree Likert scale). In order to make them fit for use online, a proprietary process is used to create and validate a new scale consisting of a minimal set of click-through, picture-based questions. We then gather data to empirically confirm the new adapted scales measure the same traits as the original scales and have sufficiently robust psychometric properties. The result is a set of empirically validated surveys, all of which tap known traits and preferences directly, each consisting of a set of these new web-friendly items that people have said are generally pretty fun.
What goes into building a new Task?
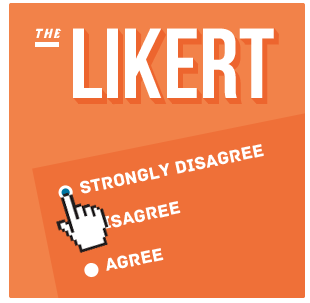
As we continue to broaden our scope of research, we continue to add new tasks or surveys to our repository. The process starts with a review of relevant literature in the fields of psychology and marketing related to what we’re trying to measure, with the goal of identifying a set of scales we or others might find useful when conducting research on a user (or consumer/person)’s motivations and habits. Typically these scales will consist of questions similar to the one shown below:
“likert.jpg”
While these scales are powerful research tools, they present the user/survey respondent with a fairly bland experience and are often quite time consuming. When you want to get the most complete or complex understanding of a person, including numerous scales like these (which are often quite lengthy) creates problems -- respondents can become fatigued and bored, and the longer a task takes, the more money and effort you will spend collecting this data. As a researcher or business, you are often left with the dilemma of whether or not to include a measure that might be valuable, knowing full well the extra cost and lack of user engagement this could entail, as well as endangering the accuracy or your data. With the Psychology API, companies are not forced to trade off good data with engaging surveys, since the IST can do both.
In our early days, we developed a seven-item survey measuring value-consciousness, which takes less than a minute to complete, and no behaviors other than someone’s answers to the survey questions must be tracked to get this information. The result of the survey requires no other data to interpret since we already know what it means and it’s easy for anyone to understand. The information can easily be used inductively and predictively to make inferences about someone’s behavior outside of TipTap Lab’s local dataset by both people and our software.
So, while most traditional research employing traditional surveys consists of items like the question above, we might create something more along the lines of this, hoping to still capture the essence of the original scale:
“ist.jpg”
The goal is to make the questions engaging and fun for the user. Various techniques can be used to make questions short and hold users’ attention; interesting or funny photos, parallel phrasing, rhyming, alliteration, or humor in wording are common techniques we’ll use.
Then comes the fun part: we analyze our newly constructed questions, compare them to the original measure we were hoping to capture, and then see whether or not we’ve captured a viable IST. It must have strong reliability/internal consistency as well as construct validity. We now have a short, fun and accurate tool that is useful for businesses, researchers and websites who want to study people and what motivates them, while still being entertaining for the users completing the surveys.